
It is often overlooked that a Firepower sensor is capable of very rich logging of a lot of interesting metrics. These can beside the normal SecOps use-cases also provide valuable insight into the health of your infrastructure. You just need to tap into the dataflow.
In an earlier article I described how a simple Elasticsearch, Logstash and Kibana) ELK stack can be setup. I will use this setup throughout this article as well to describe interesting cases. FMC could of course also be used, but many operations teams already uses a seperate logging tool such as the ELK stack.
Are my web front-end working properly?
One of the most common indications of something is wrong with a web front-end is when the HTTP responses codes from the servers is starting to produce codes like 5xx. Below is a reference table with the common ranges of HTTP response codes.
| CATEGORY | DESCRIPTION |
|---|---|
| 1xx: Informational | Communicates transfer protocol-level information. |
| 2xx: Success | Indicates that the client’s request was accepted successfully. |
| 3xx: Redirection | Indicates that the client must take some additional action in order to complete their request. |
| 4xx: Client Error | This category of error status codes points the finger at clients. |
| 5xx: Server Error | The server takes responsibility for these error status codes. |
The Firepower records all HTTP response codes that it sees and send these to our logging solution. Thus we can simply track this particular field with a filter for inbound only traffic.
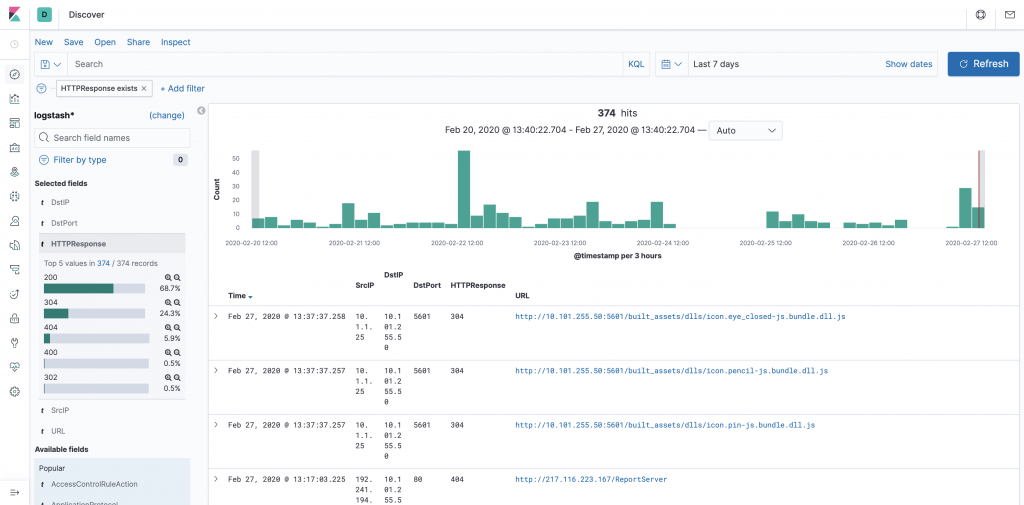
A graph representation of over time development of the count of different error codes would be nice to have for internal system monitor (all graphical widgets can be exported from Kibana as xframes or similar). If as sudden spike begins to appear with error codes some preemptive research could be warranted.
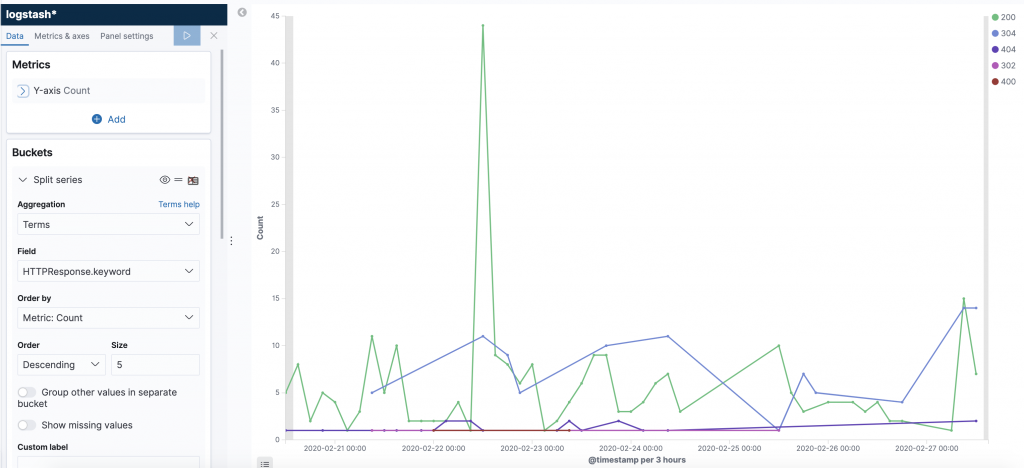
When we have pinpointed some 5xx or other interesseting non-200 codes we can drill into the concrete log message itself and see which URI ressource is misbehaving.
HTTP codes 401 and 403 are also highly interesting to monitor as these represent “unauthorized” and “forbidden”. If you start seeing these it could be an indicator of an attack or as the very least a client misconfiguration.
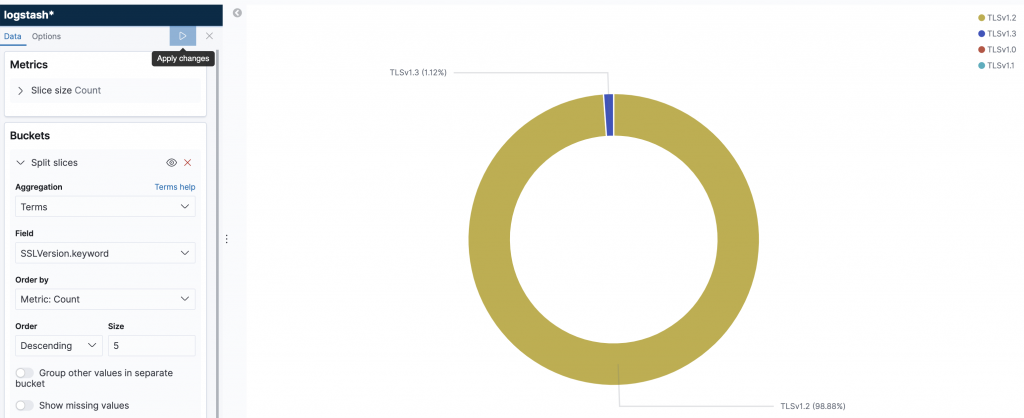
Am I using deprecated SSL crypto?
Old versions of SSL are both vulnerable and more insecure. Which is often why it pointed out by internal and external auditors that old versions are not sanctioned nor permitted.
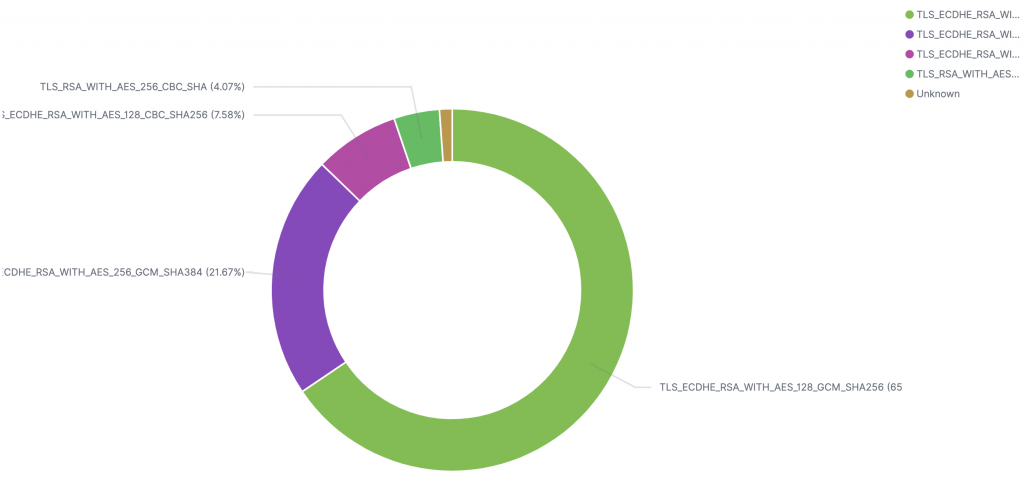
Also the ciphers used in the SSL protocol are of interest as this goes to the strength of the encryption.
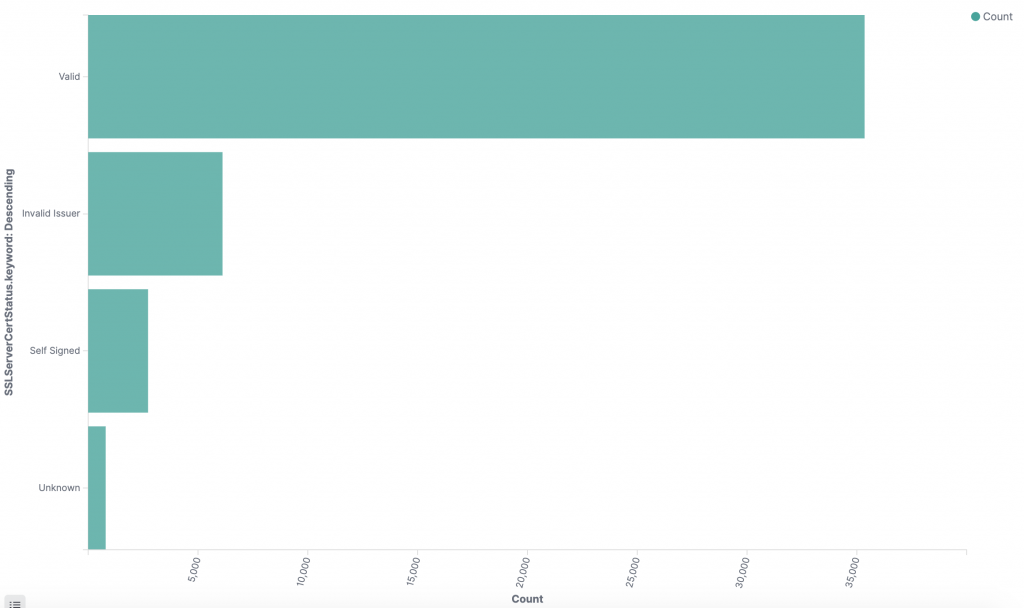
More over we can also get a view as to the health state of the certificates being used. It is generally unwise to used non-valid certificates (even if it is easier for internal system use). If you see ANY non-valid certificate being served to outside users from your servers it is a sign of misconfiguration at best.
What kind of users are connecting to my services?
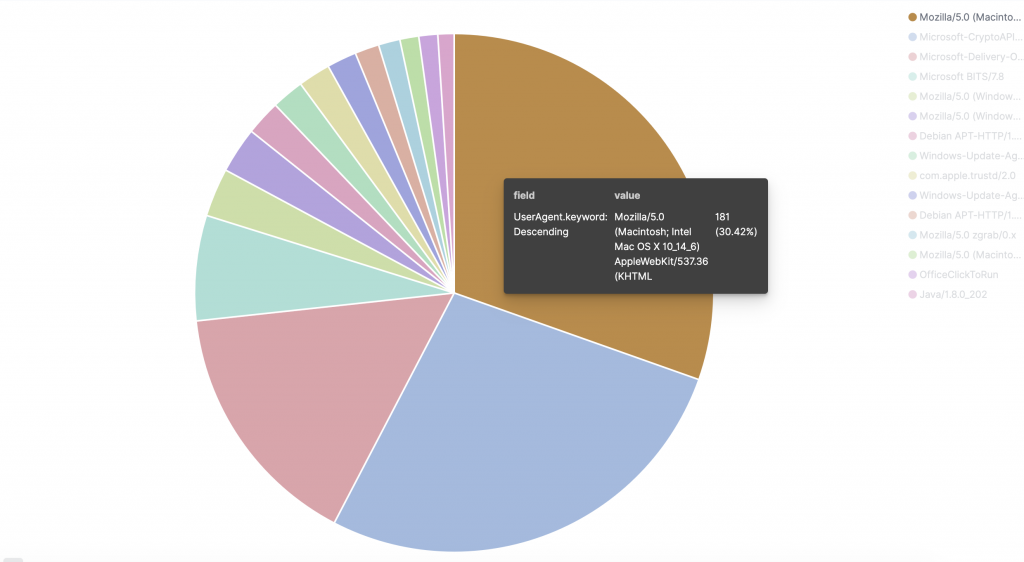
The Firepower logs the user-agent field from the HTTP headers. This indicates which kind of client is connecting to our services, and thus also makes it possible for us to optimize as appropriate.
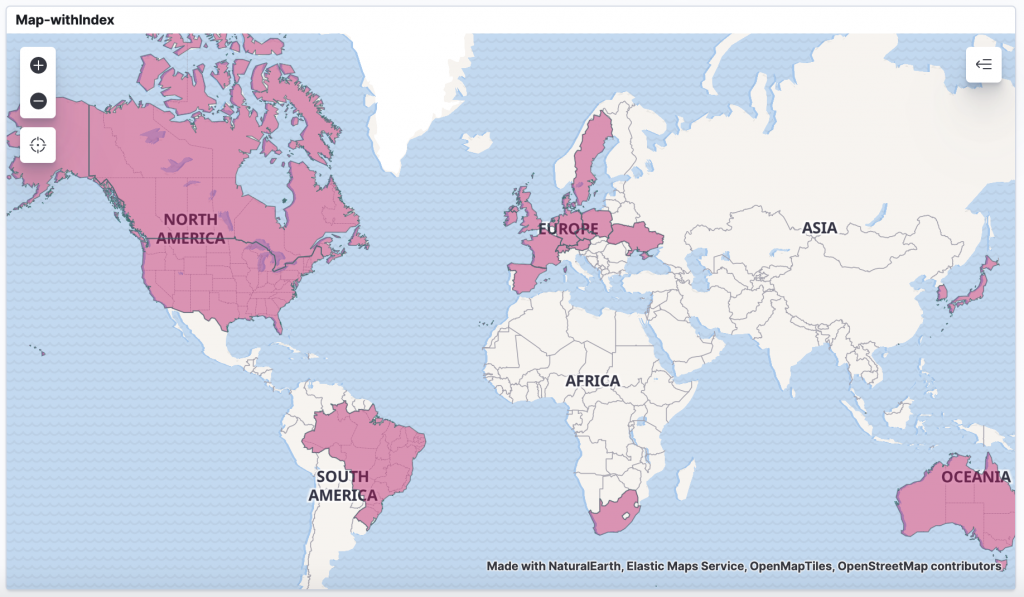
It is also very interesting to see where the users of our services are located in the world. We can map this in Kibana as we have the GeoIP data associated with each log.
Do I have misconfigurations internally?
From experience a lot of user troubles with timeouts and sluggishness is due to systems timing out internally due to misconfigured host names in various code.
Firepower logs a lot of data coming from DNS queries and this can also be easily formatted and viewed at.
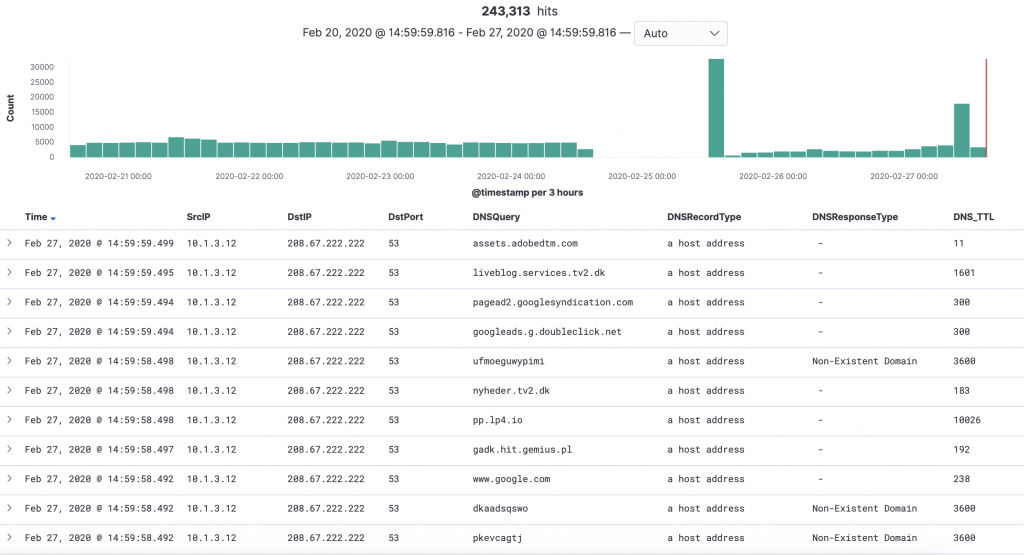
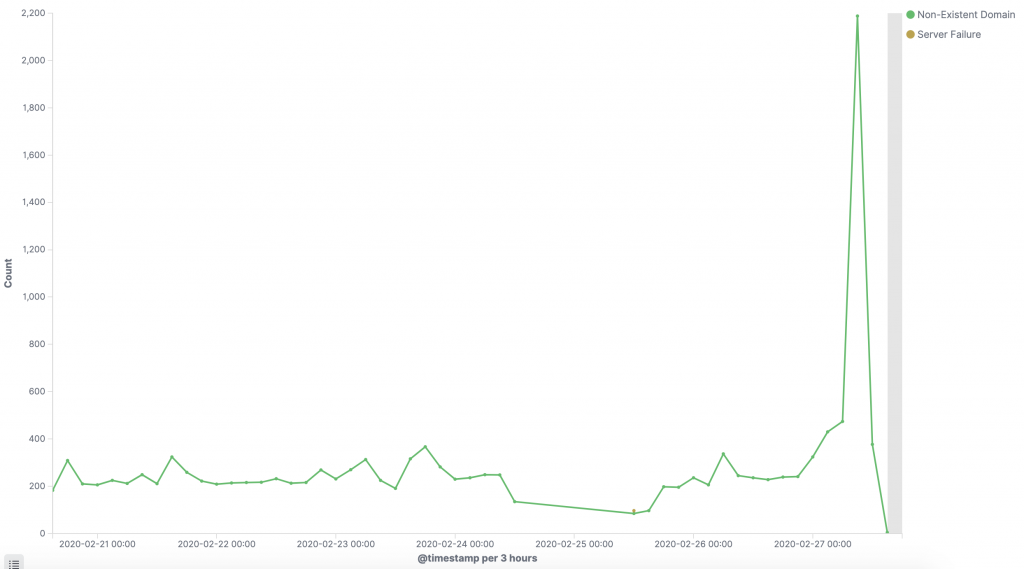
Most (arguably) interesting is the NXDOMAIN DNS response, as this indicates failures in the DNS resolution. It is furthermore a prime indicator of malware infection as these tend to use DGA (domain generating algorithms) which generate a lot of non-resolvable DNS requests. It will often show up as a spike as below.
Another place to look for misconfigurations are also in the IPS threat logs as a misconfigured system will often behave as a compromised one. Look for excessive amount of ‘false positives’ IPS alarms as these tend to be not-so-false-positives with regards to configuration.
Summary
As showcased above there is a lot of often untapped potential in the Cisco Firepower logs as these are very detailed and feature rich. I have illustrated some different use-cases here but many additional ones (most bandwidth consuming users, internal behavior analytics, servers not being utilized etc) can most likely also be thought out by others.
See the appendix of this post for a list of different fields indexed from the Firepower logs.
Be the first to comment on "Using Firepower logs for uncommon and overseen purposes"