Setting up a quick ELK stack for use with Ciscos Firepower Threat Defense has never been easier. In this article I will showcase setting up a docker version of the ELK stack, together with the appropriate (grok and kv) filter to show how such an environment can benefit from the vast amount of collected data from a FTD sensor .
The Why?
While the Firepower Management Center (FMC) often will prove sufficent for most use-cases, there are situations where the FMC may not be the optimal place for storing all logs. This is in particular true if you have:
- Very high level of connection logging
- Want to have longer retention periods
- Want to leverage purpose build large dataset search options
- Having large distributed environments.
- Want to massage your data in another way that the FMC is optimal for
- Want to map and use log data for operational purposes (tracking internal HTTP response codes, SSL certificate usage etc).
From an architectural perspective offloading logs from the FMC onto a dedicated ELK (or other SIEM) gives much higher scale as logs are sent directly from the FTD to the log solution bypassing a potential bottleneck at an FMC. Both from a log rate but also from a retention time perspective.
Sending the security related logs (ie. File and IPS logs) to FMC also, still does makes a lot of sense as the volume of these are much less than the full force of connections logs from all rules. This ensures that the FMC can still be leverage for as dedicated security console, which the all the possible integrations points for other systems.
Getting the ELK stack
For this guide we will be deploying a pre-made ELK docker infrastructure (Elasticsearch, Logstash, and Kibana in separate containers. Three containers in total). This can be simply done by cloning https://github.com/deviantony/docker-elk to ex. a Linux host with docker installed. The Github repository also provided more options and descriptions. The clone process is performed quickly with the following command.
git clone https://github.com/deviantony/docker-elk
Manipulating the config
Next we need to modify a few files. Below are highlighted with bold (docker-compose.yml and the logstash.conf) the places we need to make changes.
── docker-elk
    ├── docker-compose.yml
    ├── docker-stack.yml
    ├── elasticsearch
    │   ├── config
    │   │   └── elasticsearch.yml
 ...
    ├── logstash
    │   ├── config
    │   │   └── logstash.yml
    │   ├── Dockerfile
    │   └── pipeline
    │       └── logstash.conf
    └── README.md
We want to change the docker-compose file such that it listens for syslog on a defined port (here in this example TCP/UDP 5514). We also optionally wants to provide som more ressources for the environment. For anything productional of course we would also want to harden it some. But that is for another article.
version: '3.2'
 services:
   elasticsearch:
     ...
     environment:
       ES_JAVA_OPTS: "-Xmx2g -Xms1g"
     ...
   logstash:
     ...
     ports:
       - "5000:5000/tcp"
       - "5000:5000/udp"
       - "9600:9600"
       - "5514:5514/udp"
       - "5514:5514/tcp"
     environment:
       LS_JAVA_OPTS: "-Xmx512m -Xms512m"
     networks:
       - elk
     ...
Setting up the Logstash filter
The last thing we also will need to do is to setup the logstash filter for manipulating the Firepower format (logstash.conf file). It is pretty easy as the logformat from the FTDs follows comma separated value format. So a Grok pattern is used to trim the syslog message and a simple KV filter (key,value) is then applied. lastly GeoIP information is added to the log document.
input {
     tcp {
       port => 5000
     }
     tcp {
       port => 5514
       type => "FTDlog"
     }
     udp {
       port => 5514
       type => "FTDlog"
     }
   }
   filter {
    if [type]== "FTDlog" {
     grok {
       match=> {
        "message"=>"<%{POSINT:syslog_pri}>%{TIMESTAMP_ISO8601:timestamp}%{SPACE}\%FTD-%{DATA:severity}-%{DATA:eventid}: %{GREEDYDATA:msg}"
       }
     }
    if "_grokparsefailure" not in [tags] {
     kv {
       source => "msg"
       field_split => ","
       value_split => ":"
       trim_key => " "
     }
     geoip {
       source => "DstIP"
       target => "GeoDstIp"
     }
     geoip {
       source => "SrcIP"
       target => "GeoSrcIP"
     }
    }
    }
     mutate { remove_field => [ "msg"] }
   }
   output {
       elasticsearch {
           hosts => "elasticsearch:9200"
           user => "elastic"
           password => "changeme"
       }
   }
There are most likely many ways to get to this point.. but this is all which is required for getting a full ELK stack up and running and have indexed Firepower data in it.
Did it work?
Lastly we need to run the containers. This is done using this command
elk@elk01:~/docker-elk$ sudo docker-compose up -d
And to check all is well
elk@elk01:~/docker-elk$ sudo docker ps
CONTAINER ID        IMAGE                     COMMAND                  CREATED             STATUS              PORTS
 370fee2cd1b9        dockerelk_kibana          "/usr/local/bin/dumb…"   2 weeks ago         Up 3 hours          0.0.0.0:5601->5601/tcp
 b4db38db0ce5        dockerelk_logstash        "/usr/local/bin/dock…"   2 weeks ago         Up 3 hours          0.0.0.0:5514->5514/tcp, 0.0.0.0:5514->5514/udp
 4d6182876612        dockerelk_elasticsearch   "/usr/local/bin/dock…"   2 weeks ago         Up 3 hours          0.0.0.0:9200->9200/tcp, 0.0.0.0:9300->9300/tcp
If you are not seeing your three containers here, you have most likely messed up with the logstash filter. Check the relevant log for significant errors.
elk@elk01:~/docker-elk$ sudo docker logs dockerelk_logstash_1
If all three containers are listed and are shown listening on the correct ports you are good to go!
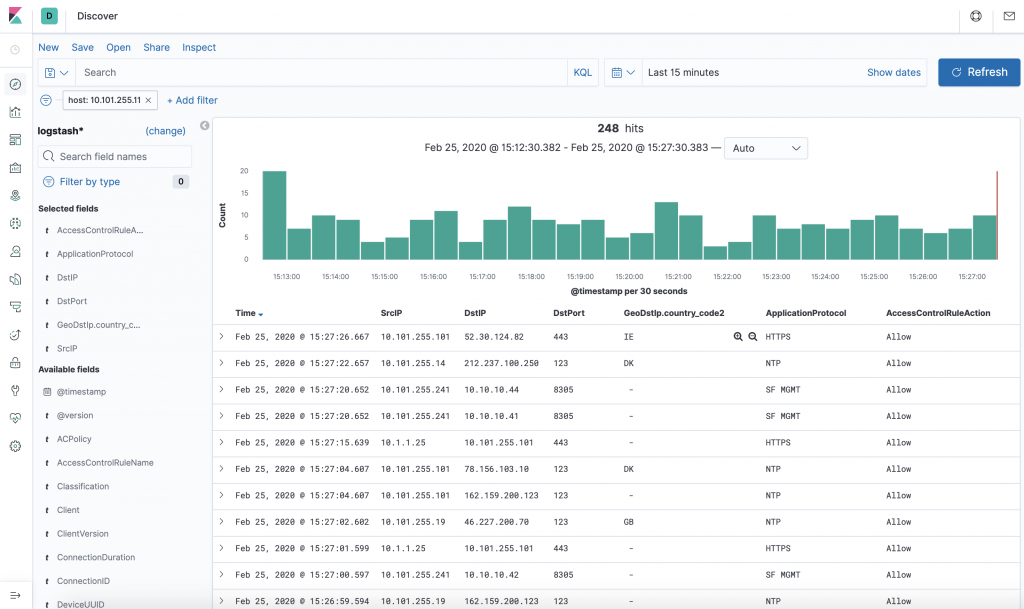
Bringing UI to the data
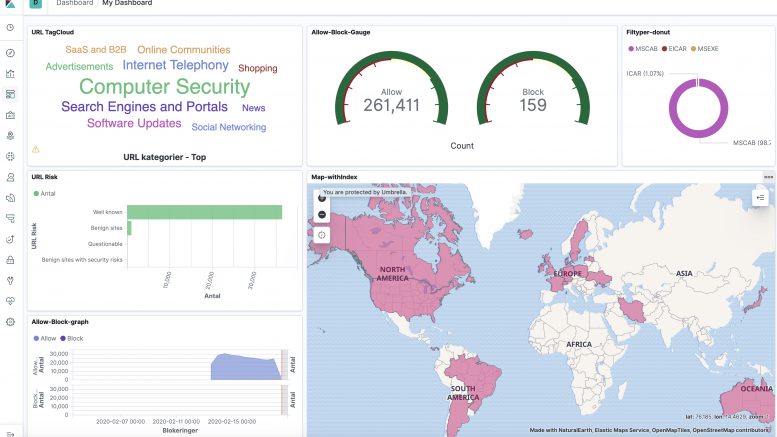
Note that the default Kibana webUI is located on port 5601. As all fields are indexed with the KV filter the vue is fully customizable.
And can be stacked in all different kinds of ways through the dashboards.
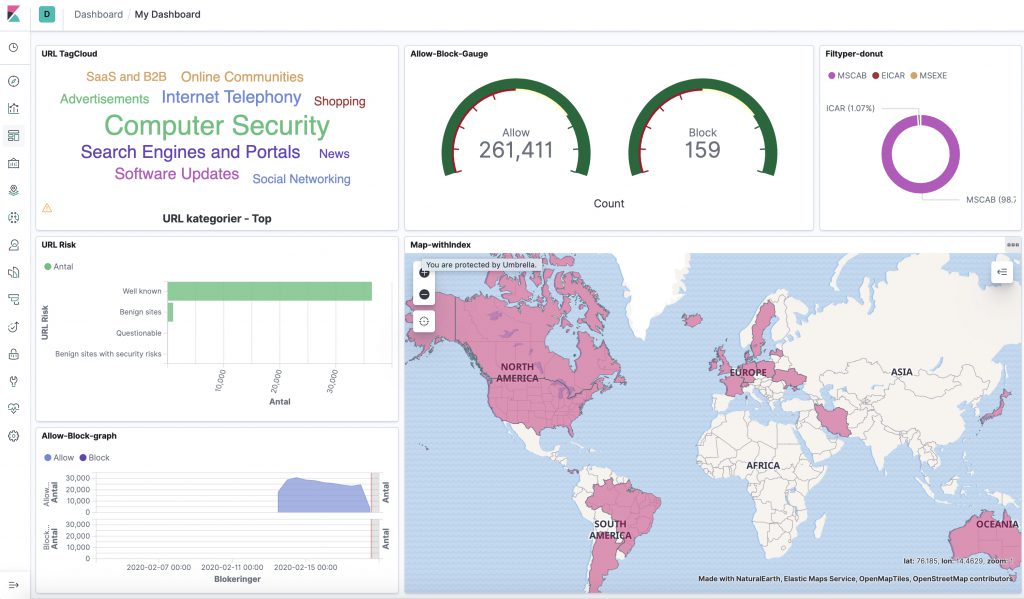
NOTE. That running this docker configuration is NONPERSISTENT… If you reload the dockers, the log data and the newly created pretty dashboards will be gone forever. Its not hard to map a persistent storage to the system however this article are mostly meant as a quick show-case for the possibilities of ELK and Firepower.
Using Kibana for day to day operations and troubleshooting
The Kibana interface is very customizable as to which data to represent. Below are my columns of choice, when using it for Connections logs and troubleshooting.
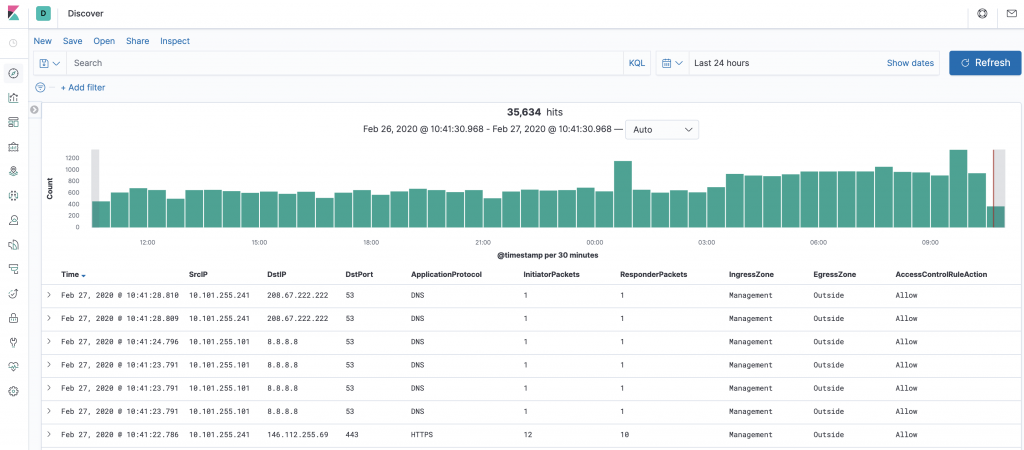
When drilling down with a search all fields are searched and the timeline bar at the top shows where there are hits in the database. In this example are given a search for “cisco.com” in all fields. We can see from the results that it is DNS queries which are being listed.
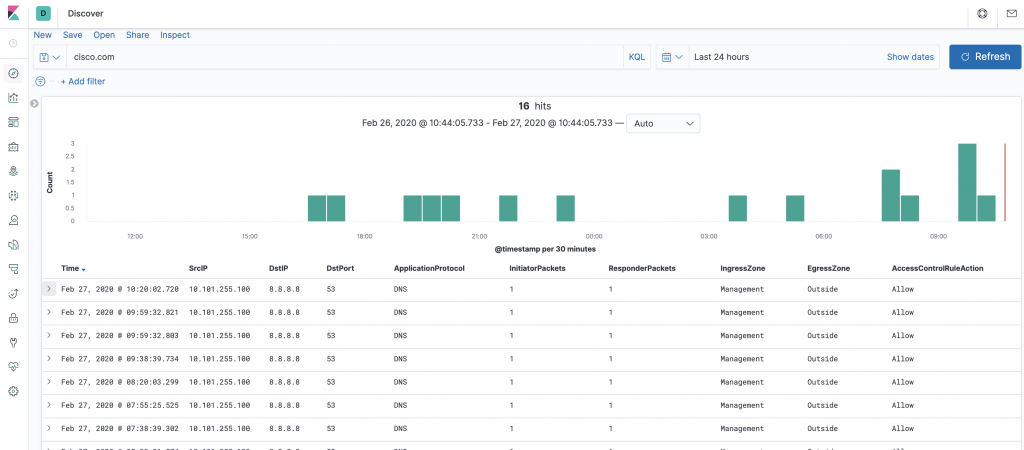
Drilling further into the event show which DNS query was performed (ns1.cisco.com) and that it was an A record lookup and other DNS related properties.
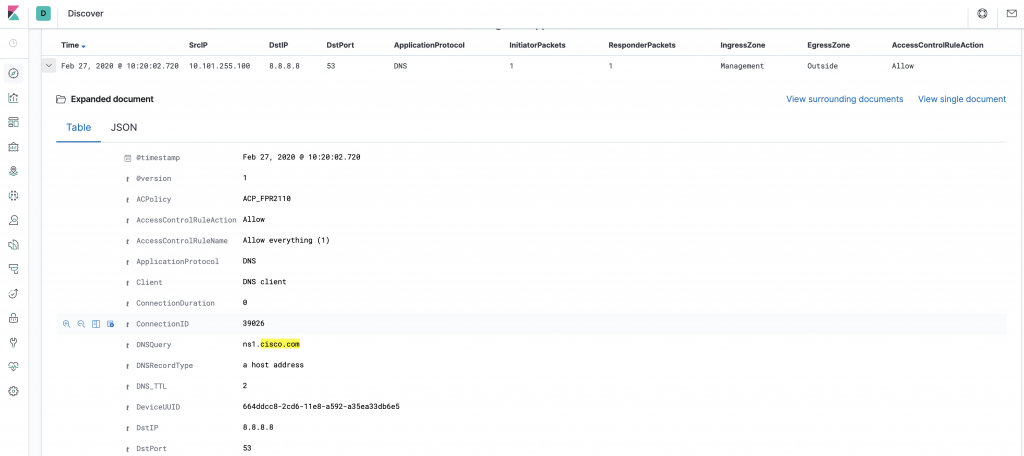
Note the very interesting “View surrounding documents” button. This pivots around and only focuses on relevant logs from the database.
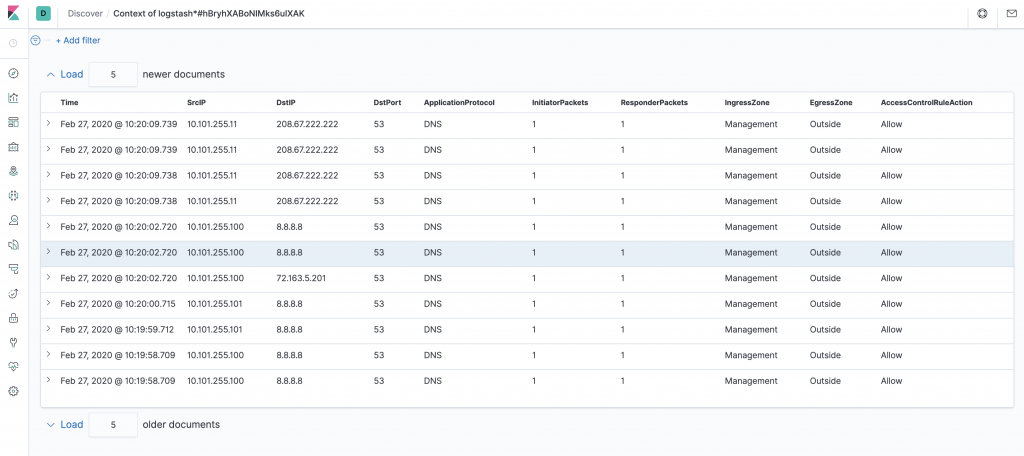
Digging into these logs I can see that other DNS records was also queried (IPv6 A record and other sub domains in this case)
References
The following Cisco Live session is all about logging from FMC to an ELK stack. It is here done using some of the other knobs available and also utilizing the eStreamer protocol. It is highly recommended reading.
https://www.ciscolive.com/c/dam/r/ciscolive/emea/docs/2018/pdf/BRKSEC-3448.pdf
If you prefer using filebeat there is a predefined Cisco module, which will handle both ASA and FTD logs (though I have not tested it yet).
https://www.elastic.co/guide/en/beats/filebeat/master/filebeat-module-cisco.html
Appendix
So what fields are being mapped to the Elasticsearch index? In my homelab the following fields are populated. The FTD only send a KV pair if it has anything meaningfull to add to the log content depends on the log type. Also even more log fields can be gathered if also drawing on the FMC for additional info (see the Cisco Live presentation referenced above).
@timestamp@versionACPolicyAccessControlRuleActionAccessControlRuleNameAccessControlRuleReasonApplicationProtocolArchiveFileNameArchiveFileStatusClassificationClientClientVersionConnectionDurationConnectionIDDNSQueryDNSRecordTypeDNSResponseTypeDNSSICategoryDNS_TTLDeviceUUIDDstIPDstPortEgressInterfaceEgressZoneEventPriorityFileActionFileCountFileDirectionFileNameFilePolicyFileSHA256FileSandboxStatusFileSizeFileStaticAnalysisStatusFileStorageStatusFileTypeFirstPacketSecondGIDGeoDstIpGeoSrcIPHTTPRefererHTTPResponseICMPCodeICMPTypeIPReputationSICategoryIPSCountIngressInterfaceIngressZoneInitiatorBytesInitiatorPacketsInlineResultInstanceIDIntrusionPolicyMessageNAPPolicyPrefilter PolicyPriorityProtocolReferencedHostResponderBytesResponderPacketsRevisionSHA_DispositionSIDSSLActualActionSSLCertificateSSLCipherSuiteSSLExpectedActionSSLFlowStatusSSLPolicySSLRuleNameSSLServerCertStatusSSLSessionIDSSLTicketIDSSLVersionSecIntMatchingIPSperoDispositionSrcIPSrcPortThreatNameThreatScoreURIURLURLCategoryURLReputationUserUserAgentWebApplicationeventidhostmessageportseveritysyslog_pritagstimestamptype
Below is a ELK JSON formatted representation of a FTD syslog.
{
   "_index": "logstash",
   "_type": "_doc",
   "_id": "-RG5fHABoNIMks6u8Yrn",
   "_version": 1,
   "_score": null,
   "_source": {
     "message": "<113>2020-02-25T14:19:55Z   %FTD-1-430003: EventPriority: Low, DeviceUUID: 664ddcc8-2cd6-11e8-a592-a35ea33db6e5, InstanceID: 2, FirstPacketSecond: 2020-02-25T14:19:55Z, ConnectionID: 2685, AccessControlRuleAction: Allow, SrcIP: 10.101.255.101, DstIP: 81.94.123.17, SrcPort: 123, DstPort: 123, Protocol: udp, IngressInterface: Mgmt_Network, EgressInterface: Outside, IngressZone: Management, EgressZone: Outside, ACPolicy: ACP_FPR2110, AccessControlRuleName: Allow everything (1), Prefilter Policy: Default Prefilter Policy, User: administrator, Client: NTP client, ApplicationProtocol: NTP, ConnectionDuration: 0, InitiatorPackets: 1, ResponderPackets: 1, InitiatorBytes: 94, ResponderBytes: 90, NAPPolicy: NAP_SecLab",
     "severity": "1",
     "GeoSrcIP": {},
     "IngressZone": "Management",
     "ResponderBytes": "90",
     "port": 54775,
     "DeviceUUID": "664ddcc8-2cd6-11e8-a592-a35ea33db6e5",
     "AccessControlRuleName": "Allow everything (1)",
     "@version": "1",
     "ACPolicy": "ACP_FPR2110",
     "@timestamp": "2020-02-25T14:22:05.696Z",
     "ConnectionID": "2685",
     "DstIP": "81.94.123.17",
     "NAPPolicy": "NAP_SecLab",
     "GeoDstIp": {
       "country_code2": "CH",
       "location": {
         "lat": 47.1449,
         "lon": 8.1551
       },
       "ip": "81.94.123.17",
       "country_code3": "CH",
       "longitude": 8.1551,
       "timezone": "Europe/Zurich",
       "country_name": "Switzerland",
       "continent_code": "EU",
       "latitude": 47.1449
     },
     "AccessControlRuleAction": "Allow",
     "FirstPacketSecond": "2020-02-25T14:19:55Z",
     "SrcPort": "123",
     "timestamp": "2020-02-25T14:19:55Z",
     "SrcIP": "10.101.255.101",
     "ApplicationProtocol": "NTP",
     "InitiatorPackets": "1",
     "InitiatorBytes": "94",
     "eventid": "430003",
     "DstPort": "123",
     "syslog_pri": "113",
     "type": "FTDlog",
     "IngressInterface": "Mgmt_Network",
     "Client": "NTP client",
     "EgressZone": "Outside",
     "ResponderPackets": "1",
     "tags": [
       "_geoip_lookup_failure"
     ],
     "Prefilter Policy": "Default Prefilter Policy",
     "EventPriority": "Low",
     "InstanceID": "2",
     "ConnectionDuration": "0",
     "User": "administrator",
     "host": "10.101.255.11",
     "Protocol": "udp",
     "EgressInterface": "Outside"
   },
   "fields": {
     "FirstPacketSecond": [
       "2020-02-25T14:19:55.000Z"
     ],
     "@timestamp": [
       "2020-02-25T14:22:05.696Z"
     ],
     "timestamp": [
       "2020-02-25T14:19:55.000Z"
     ]
   },
   "highlight": {
     "host": [
       "@kibana-highlighted-field@10.101.255.11@/kibana-highlighted-field@"
     ]
   },
   "sort": [
     1582640525696
   ]
 }
Thank you very much for this article.
Can you explain how to properly configure the logs on the FTD side?
Thanks again.
Thank you for you article!
I can see the packets coming from the FTD to the ELK on udp port 5514 – but how can I see anything in Kibana?
Thanks